
Know what your numbers mean, and what to do about them
The CFO your startup has been missing
Marge gives startups the financial expertise of a CFO, without the cost or complexity of hiring one. It turns your financials into clear answers, actionable insights, and better decisions.
Understand what’s driving your business. Know where you stand. Forecast what comes next. Model your options. Benchmark your performance. Ask questions about your numbers. Prepare for your board.
Everything you expect from a CFO, in one place.
Free for 14 days on Growth. No charge until the trial ends. Cancel anytime.
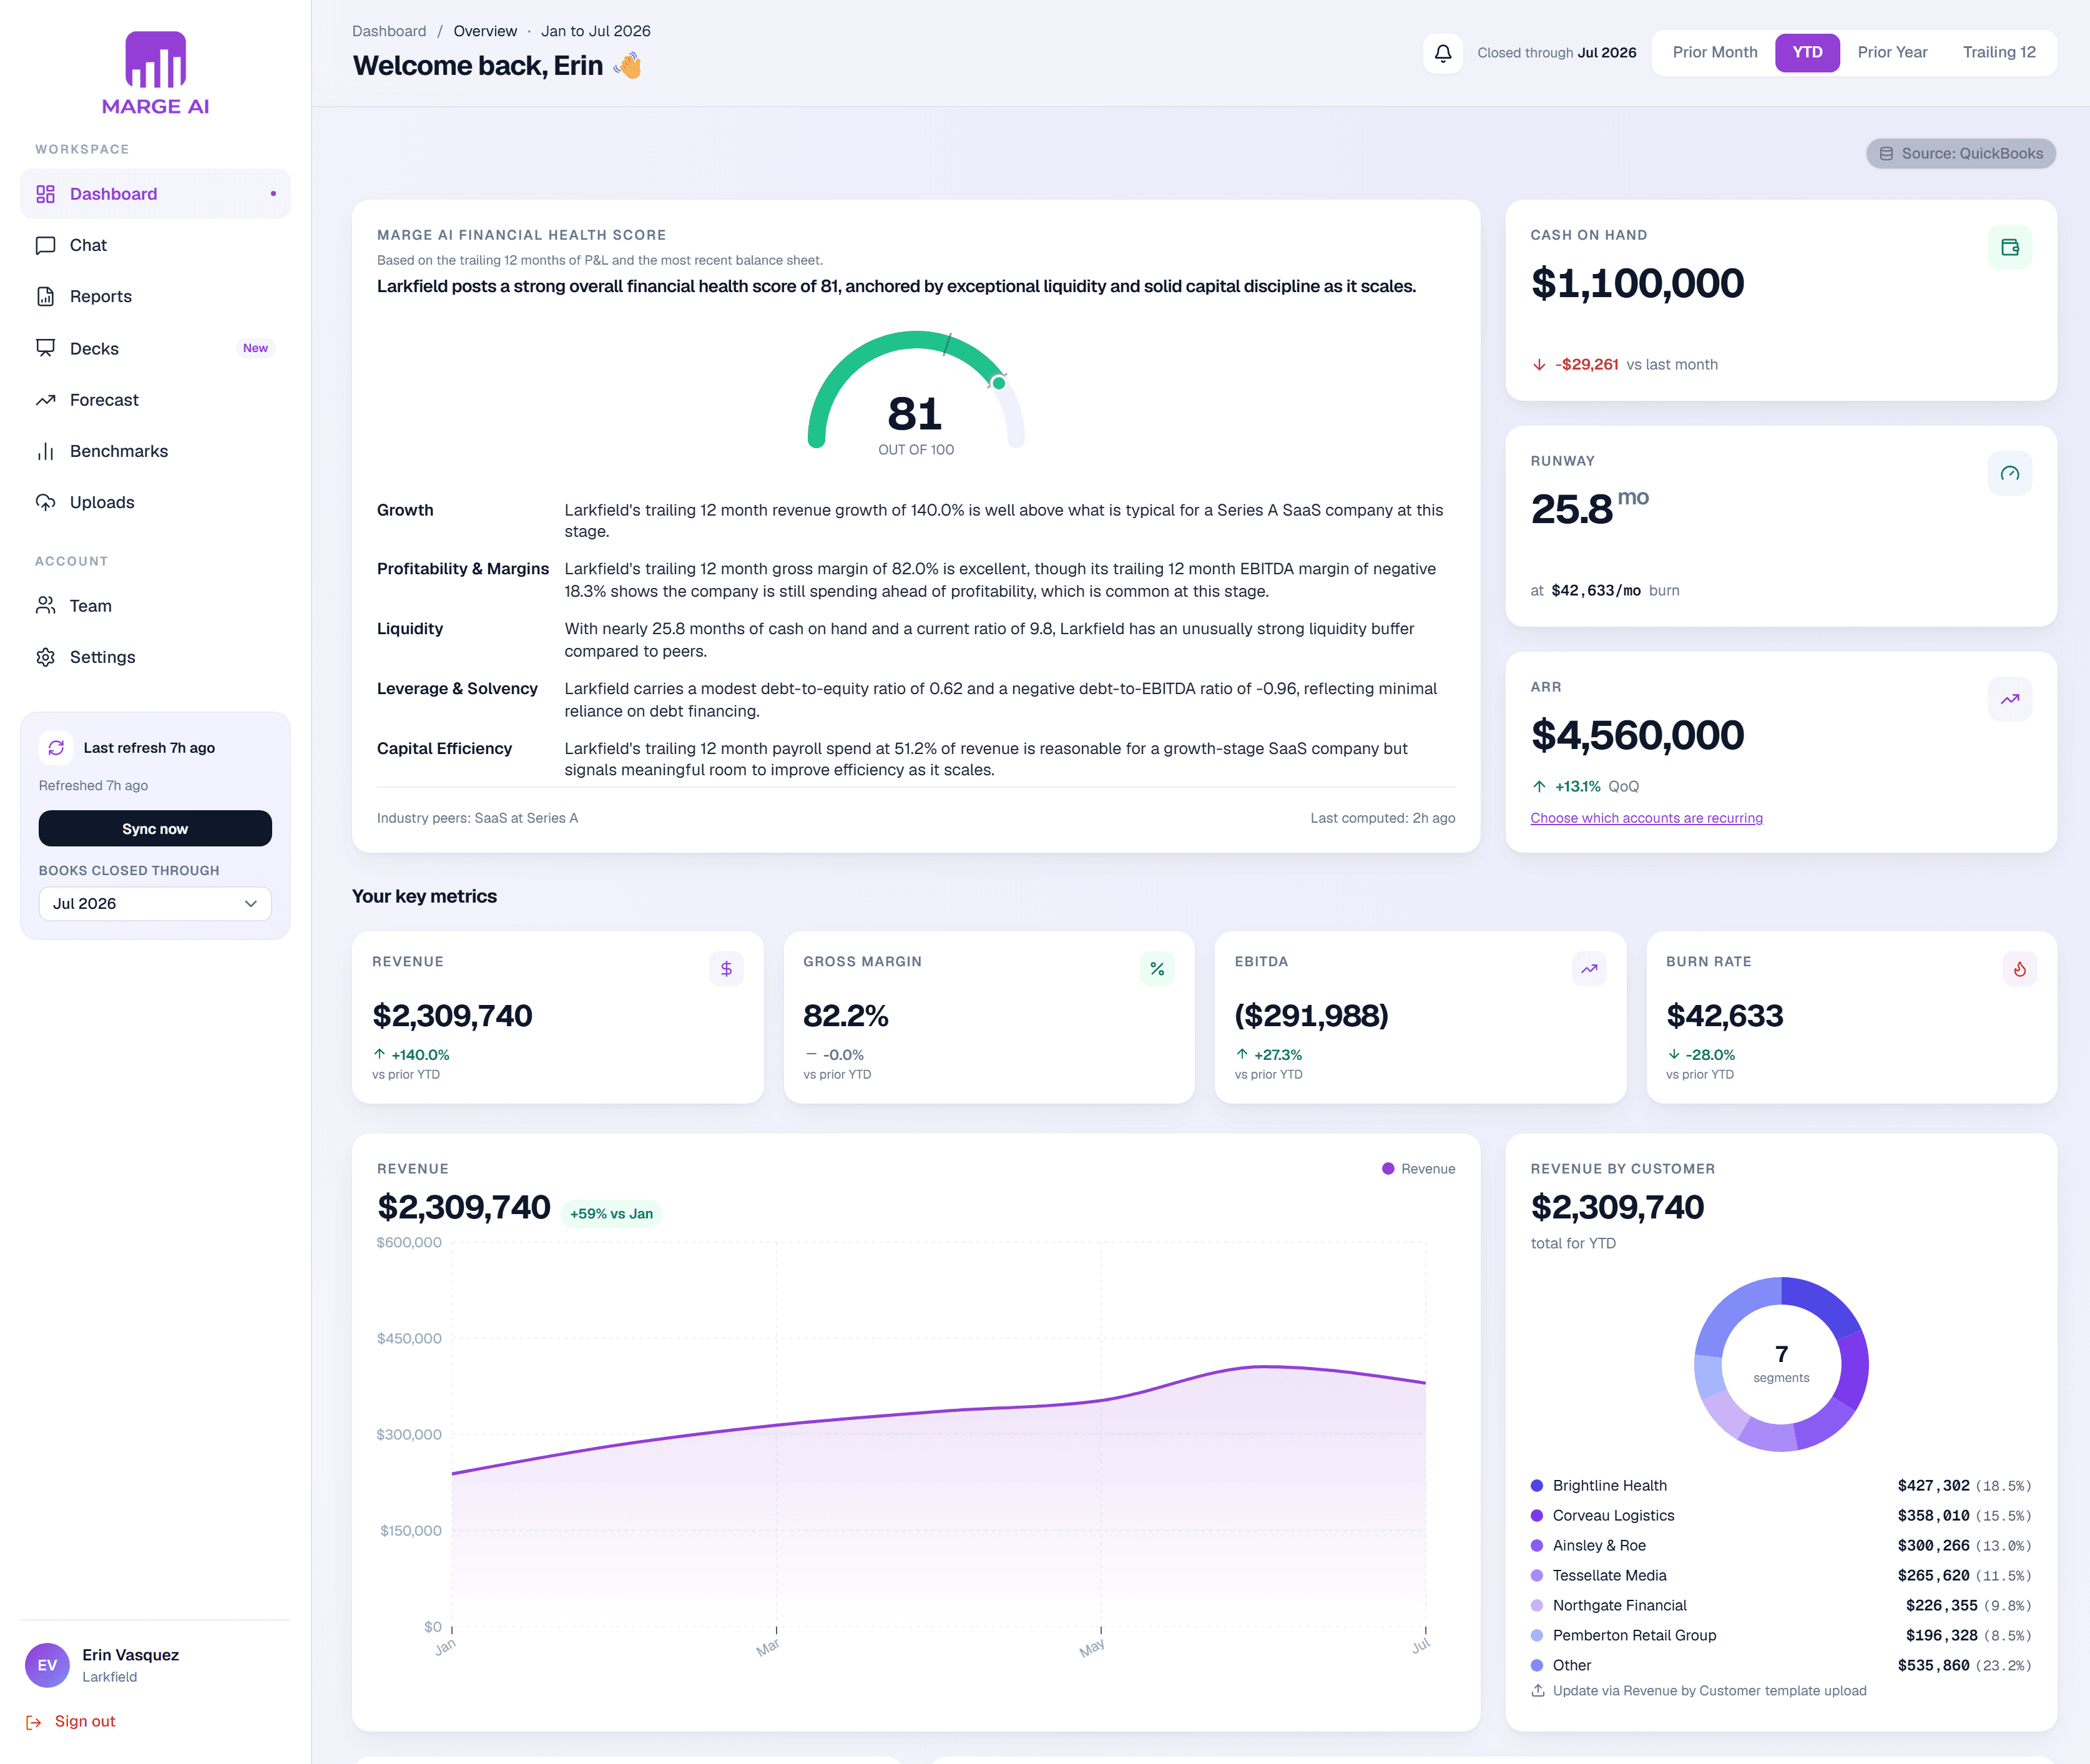
See Marge in 90 seconds
A quick tour of the dashboard, health score, Ask Marge, forecasts, benchmarks and board decks, shown on a demo company.
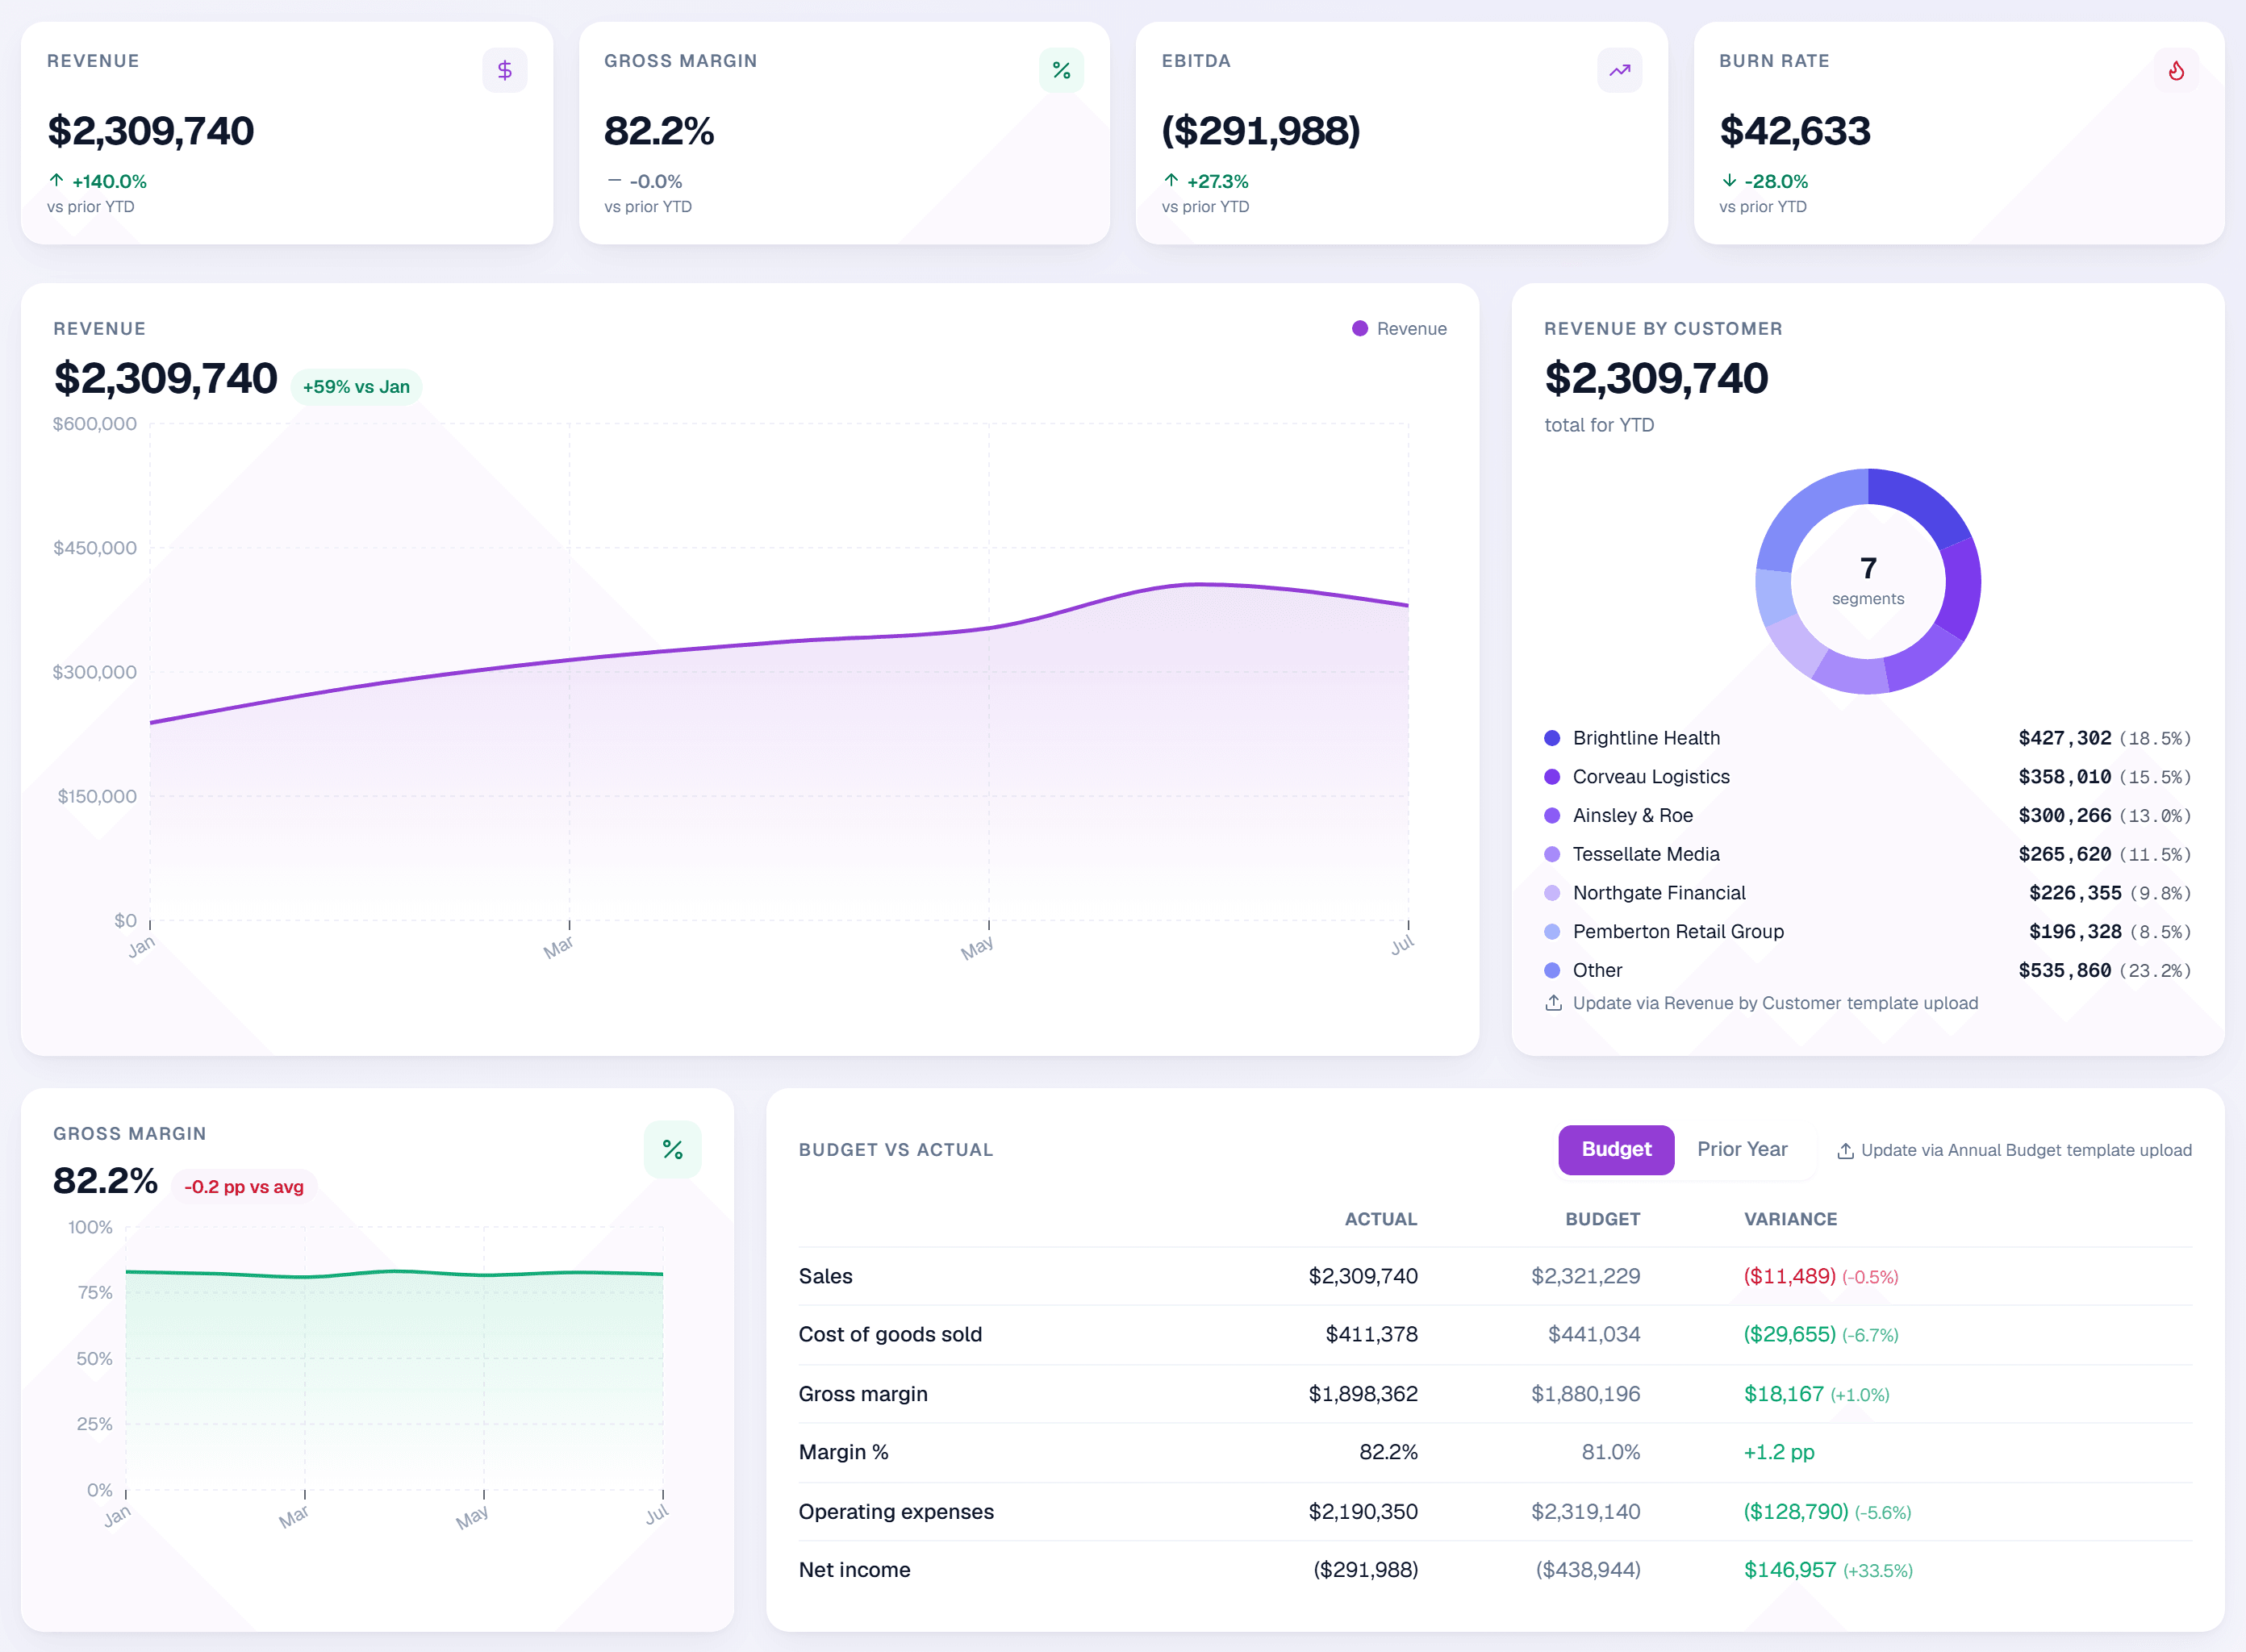
Know the financial health of your business at a glance
A fast, consistent read on financial position, recalculated every time your books update. It comes with a written explanation: what is strong, what is weakening, and which figure to look at first. The score takes into account your specific industry and stage of your company.
See your score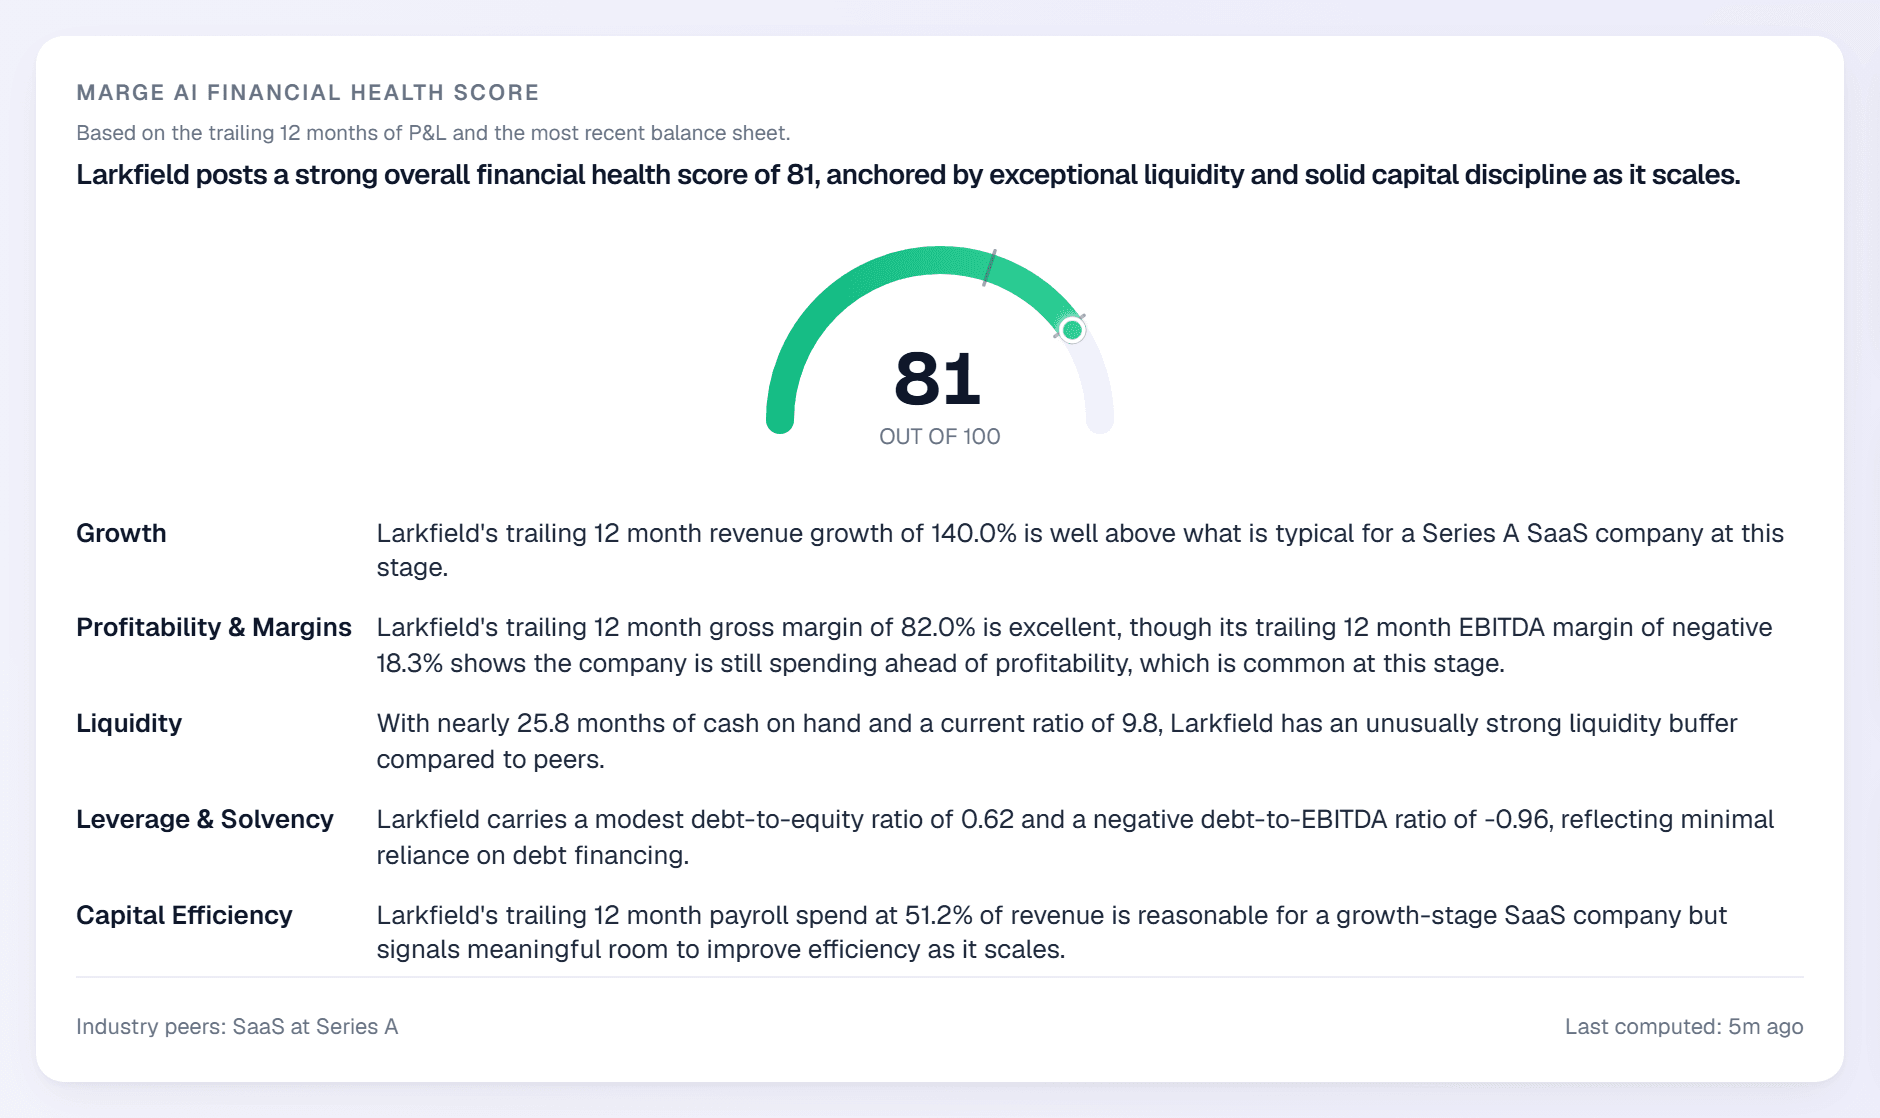
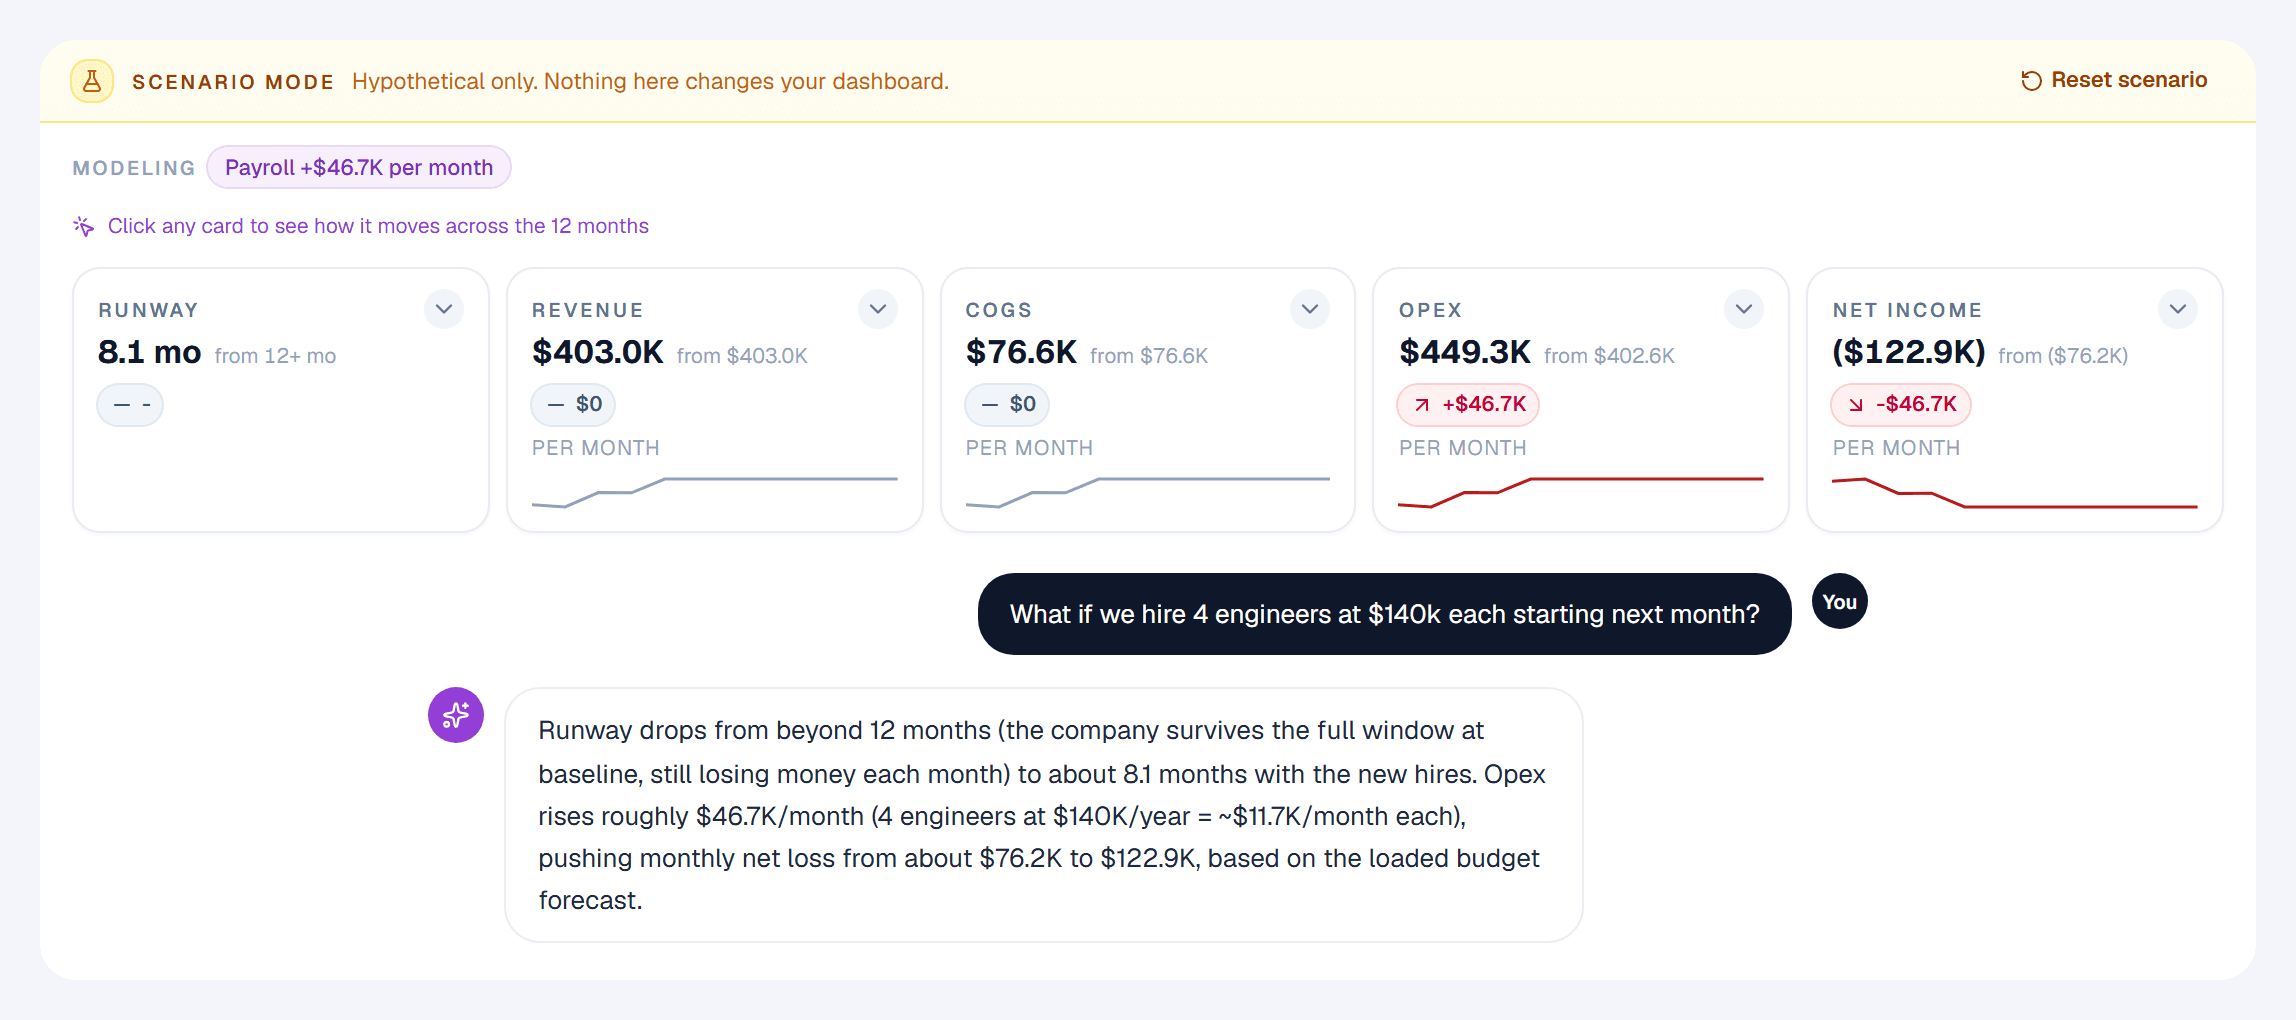
Answers about your own numbers, in seconds
Ask the questions you would put to a CFO, or model a what-if and watch runway, burn and net income move.
- The answers arrive in seconds, not after weeks of digging
- Marge stores context for follow up questions
- Scenarios are hypothetical: nothing you test changes your dashboard
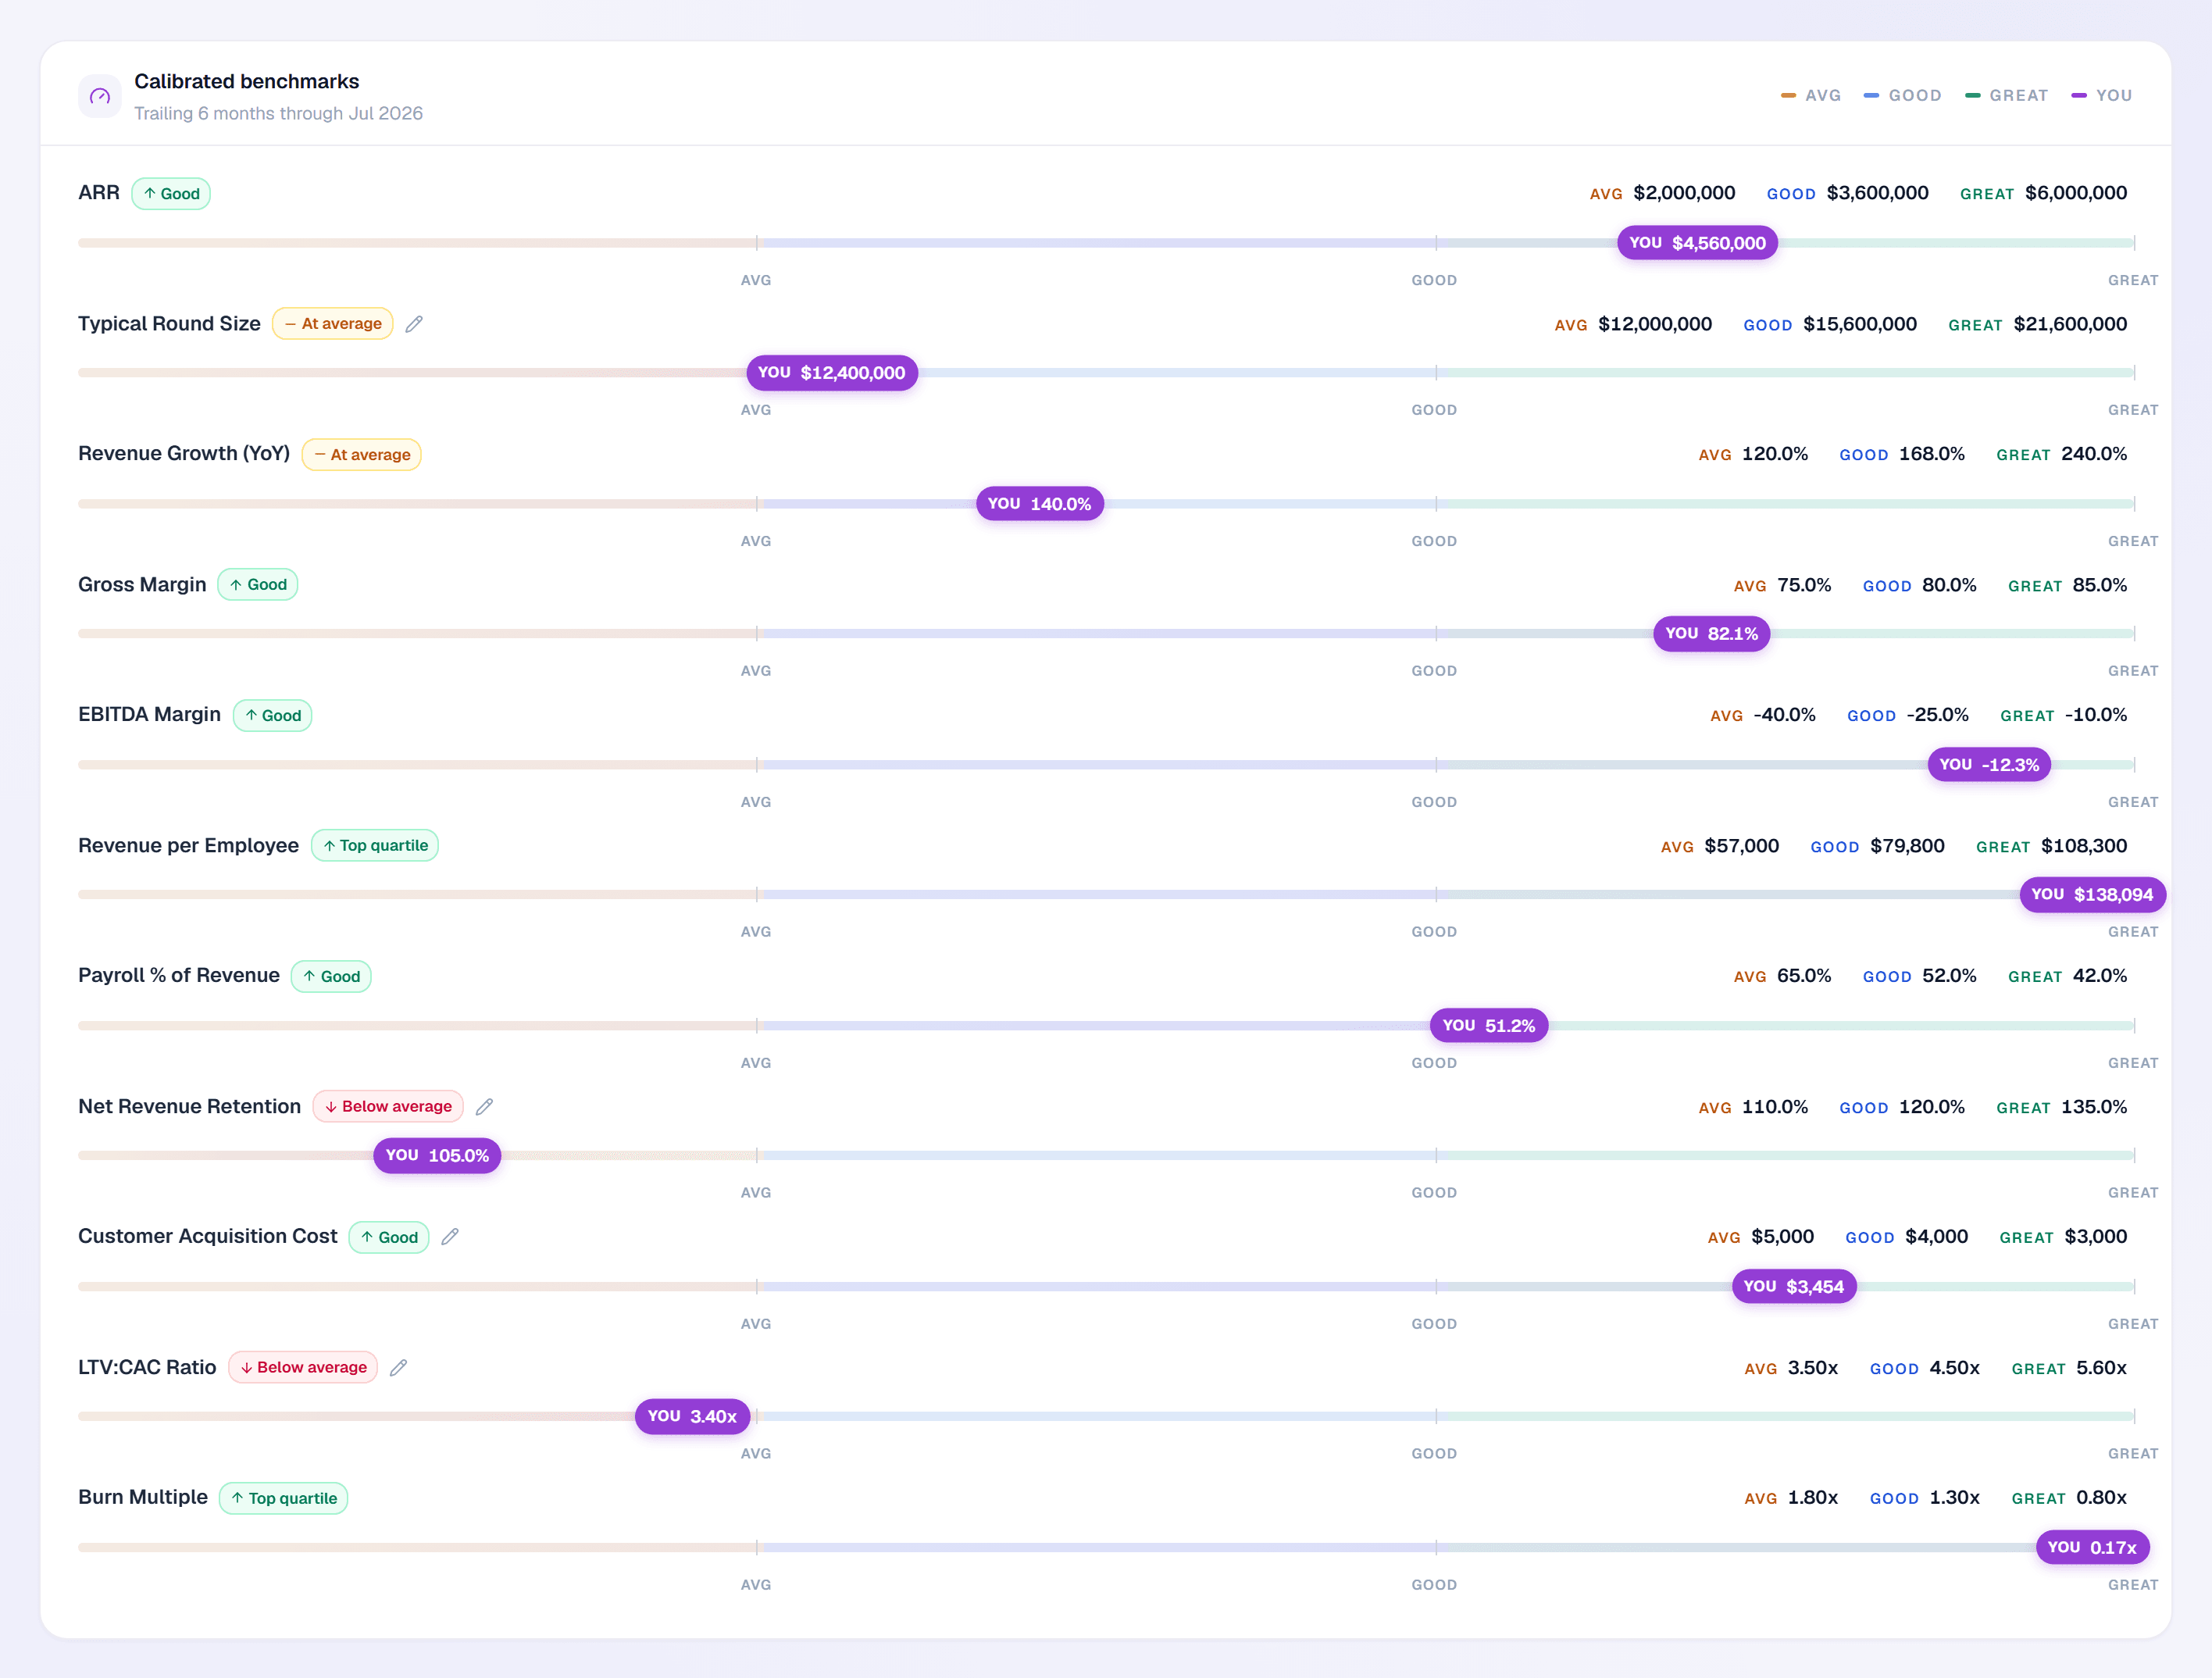
See how you compare to companies like yours
Metrics measured against your industry at your stage, so you know which numbers are genuinely a problem.
- Matched on industry and funding stage, not a blended average
- Shows where you lead and where you lag
- Gives you the language for investor conversations
Every number that matters, all in one place
- Get the financial picture you need to make better decisions
- See what’s changing across revenue, margins, burn and runway
- Know where your business is performing well, and where it needs attention
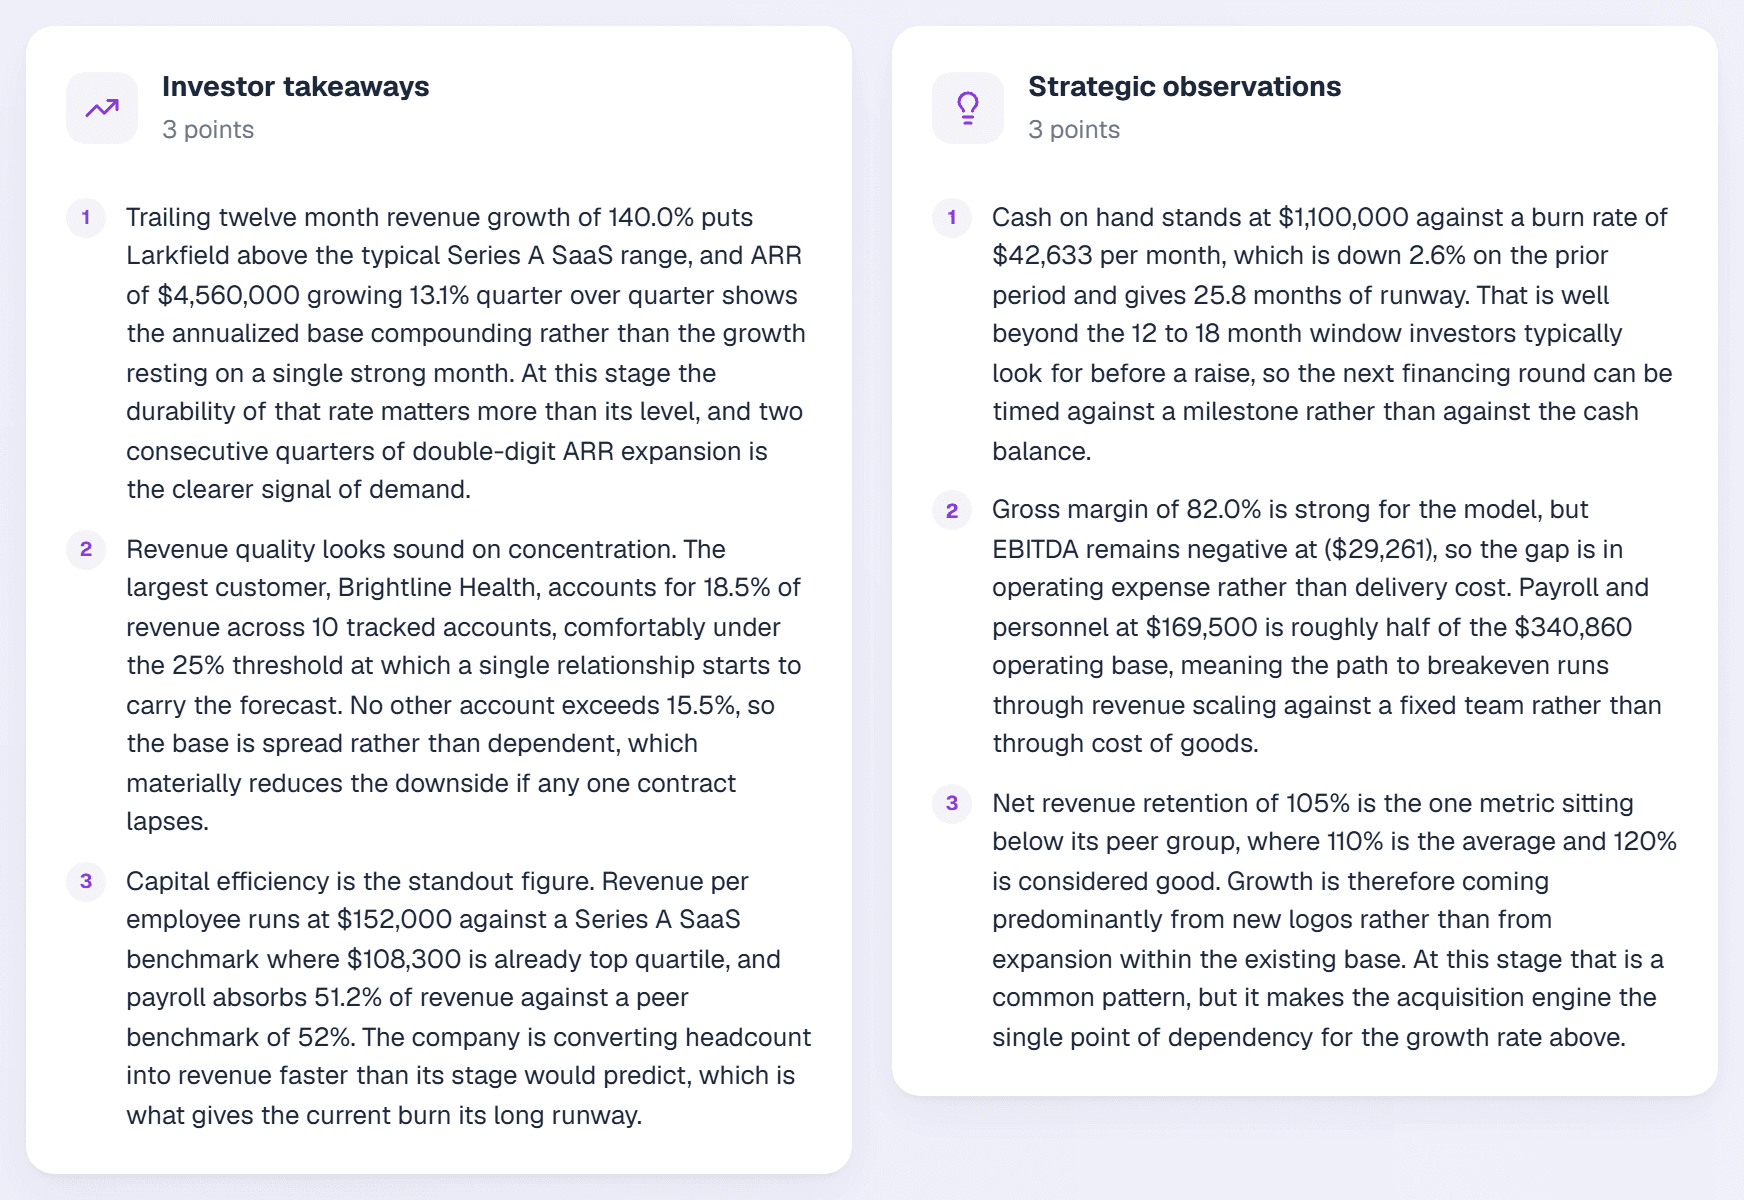
The written evaluation most founders never get
Every close, Marge writes what the numbers mean: what improved, what is drifting, and which figure deserves attention before it turns into a problem.
- Observations drawn from your figures, not a template
- Investor takeaways ready for the next update
- Rewritten whenever your data changes
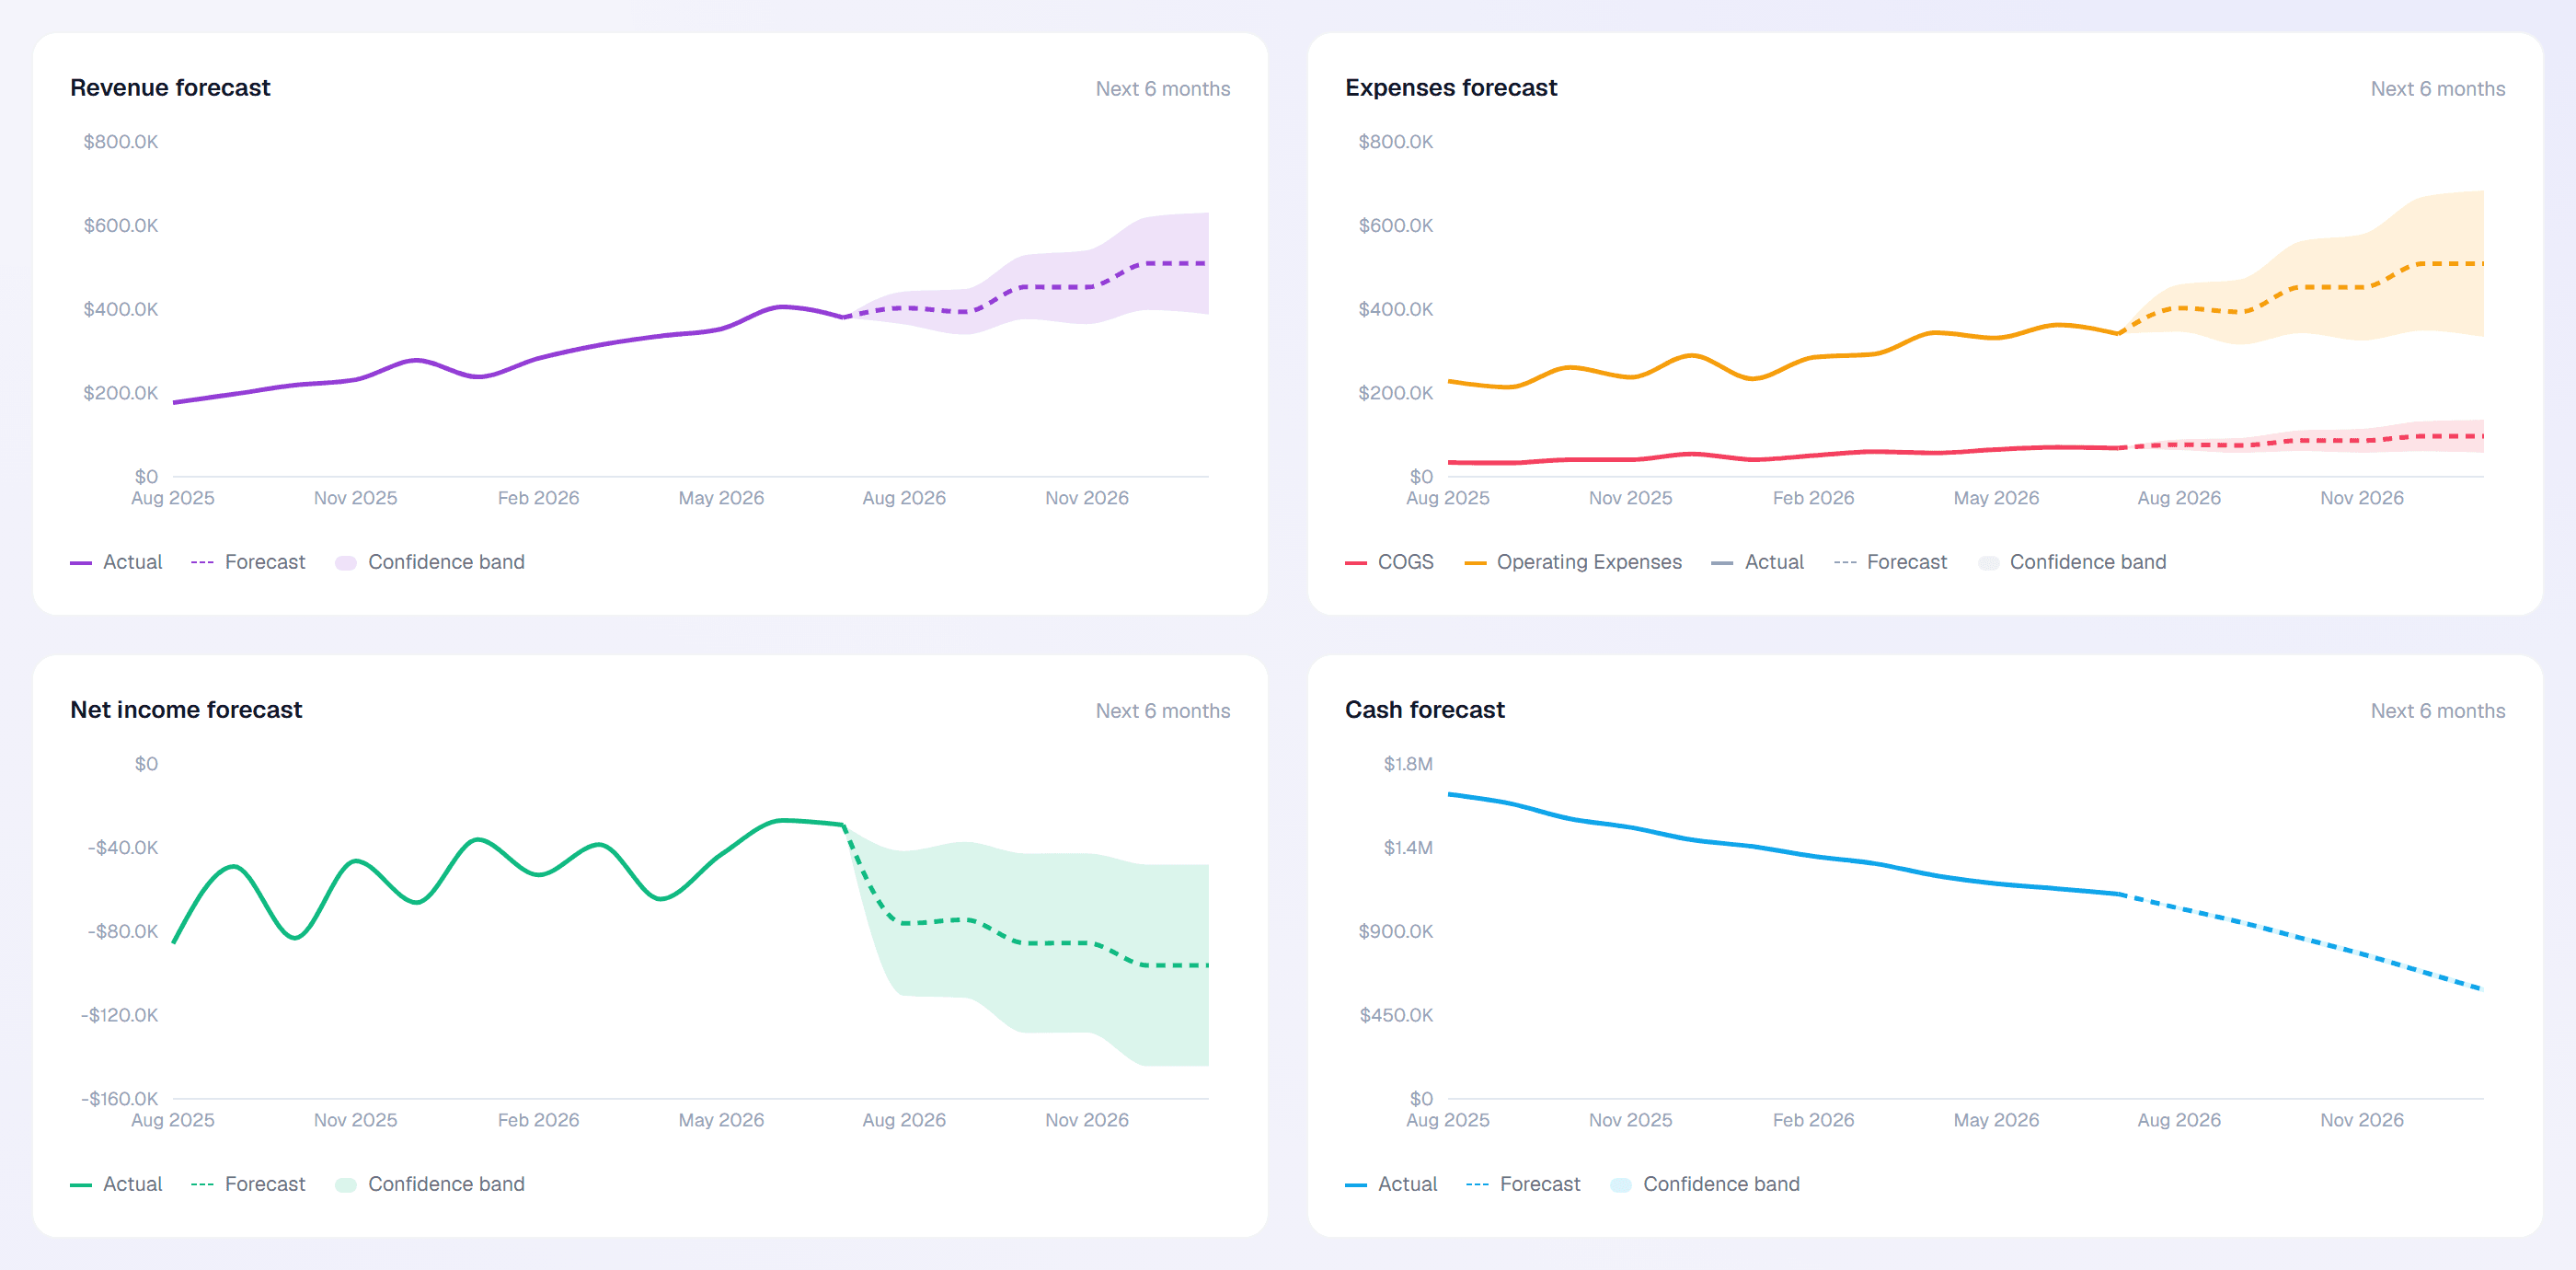
Know when cash runs out, before it does
Project runway and revenue from your actuals, then test a hire, a raise or a change in spend and see the effect right away.
- Built from your real history, not an empty spreadsheet
- Model a scenario without disturbing the base case
- Runway recalculated as the inputs change
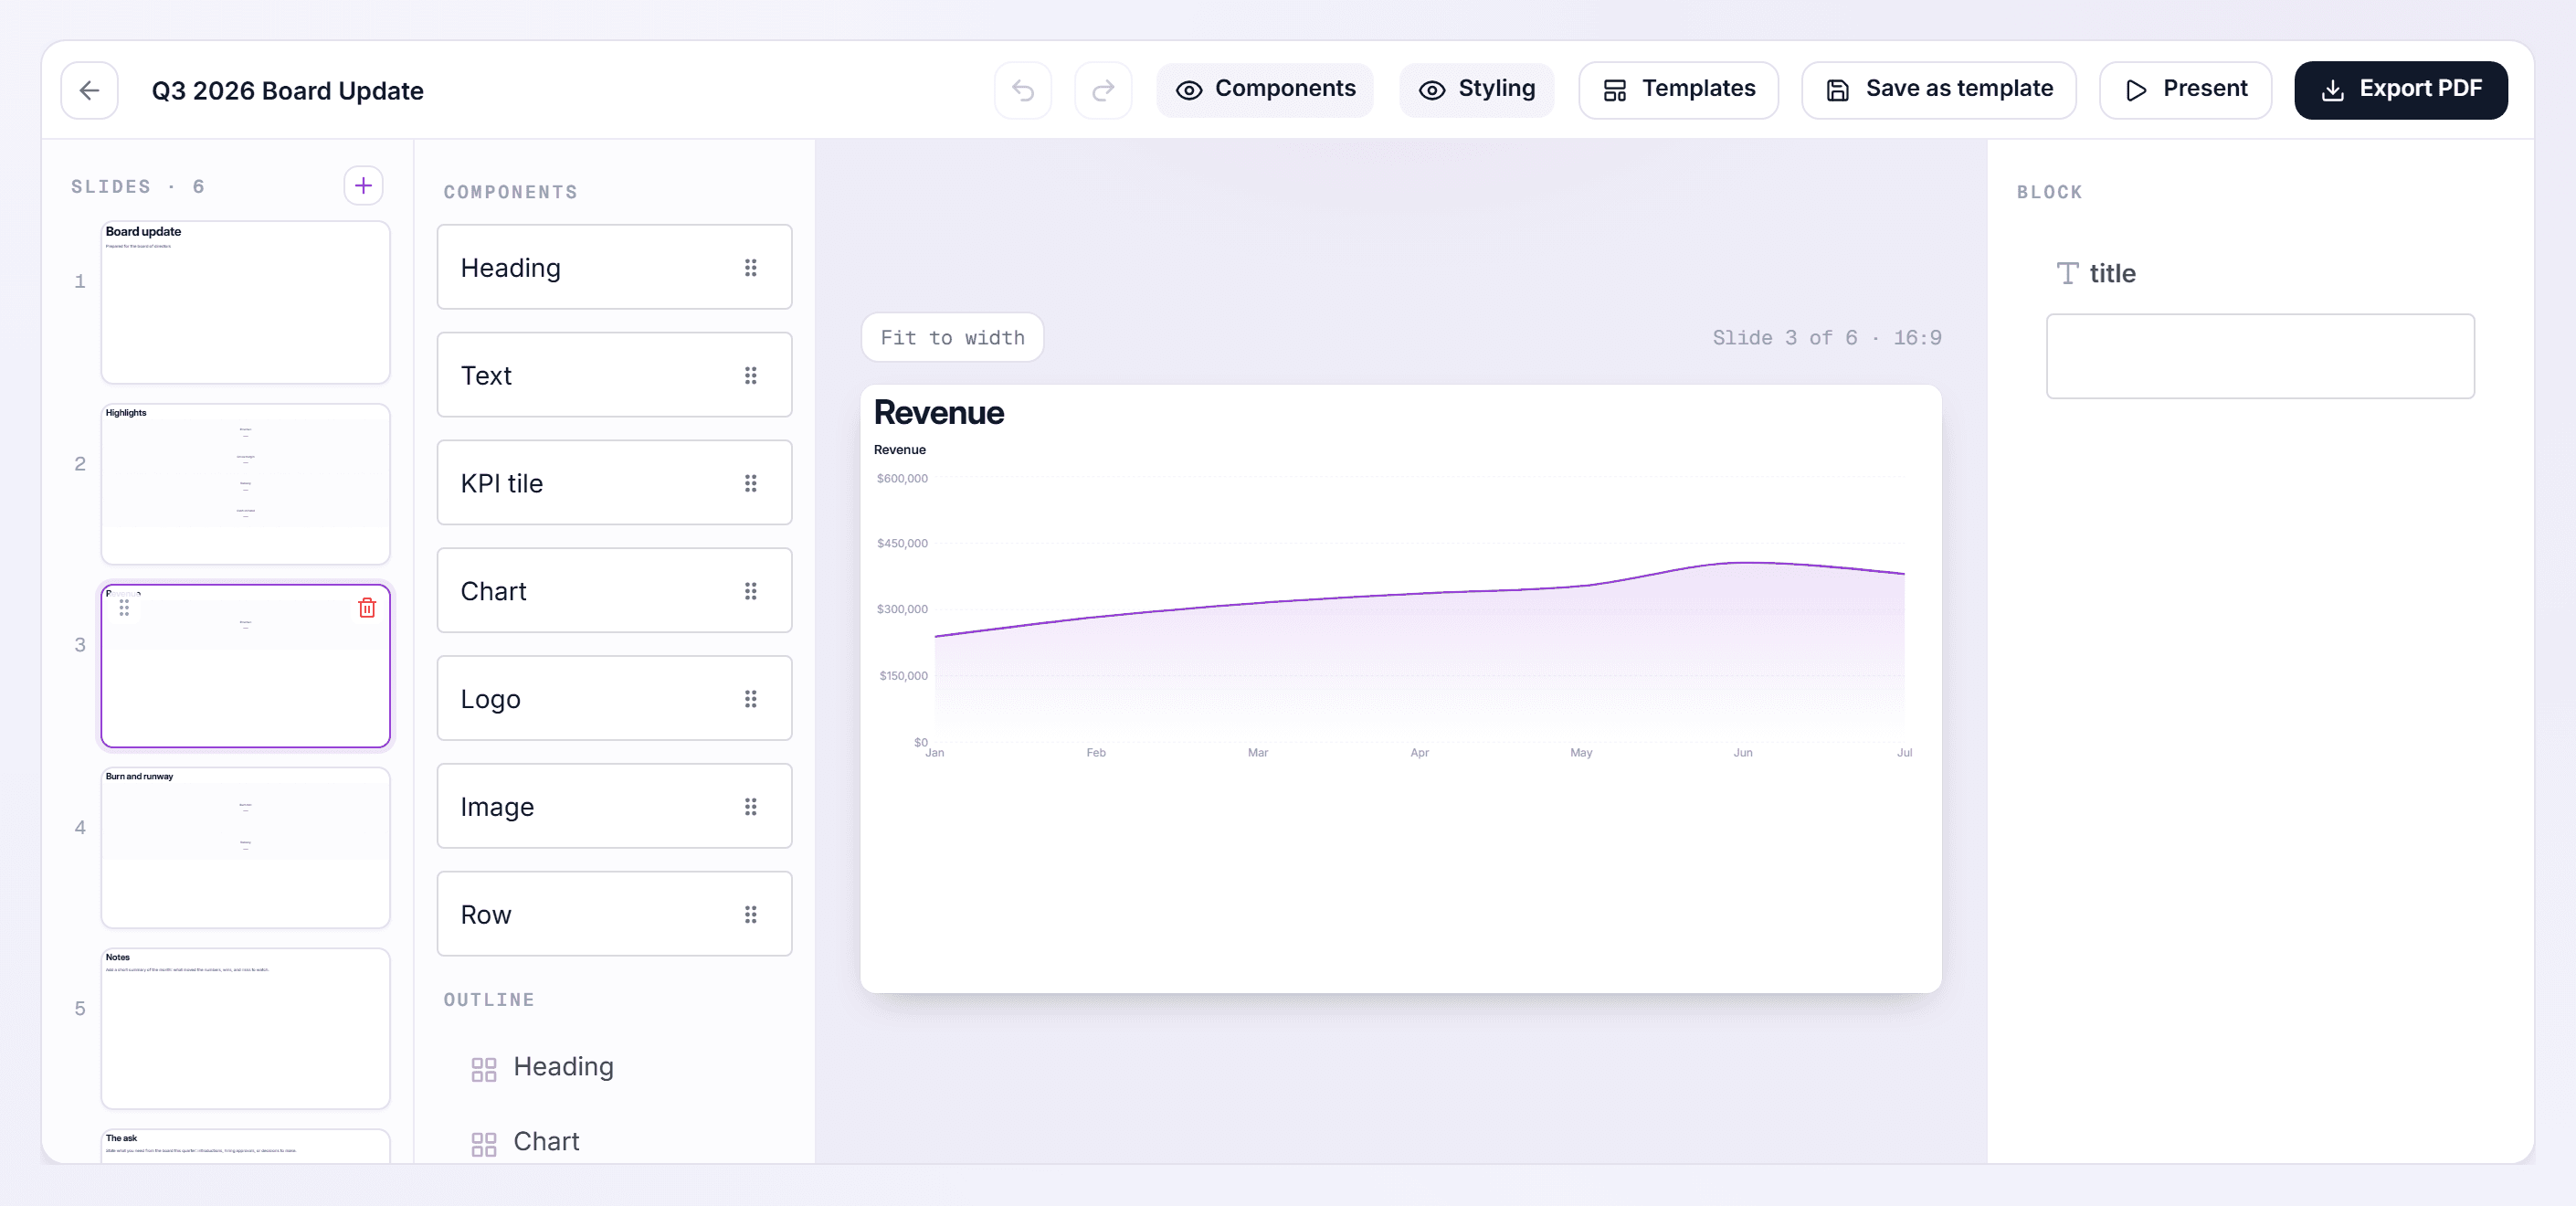
A board deck built from your live numbers
Start from a board template and the slides arrive already bound to your figures. Edit anything, present it, or export to PDF.
- KPI tiles and charts read from your books, not a paste
- Templates for a board update, investor update or one-pager
- Present from the browser, or export to PDF
Three steps, about ten minutes
No onboarding call, no implementation project, no spreadsheets to maintain.
Connect QuickBooks or upload your data
Connect QuickBooks and/or upload your financial data. Marge pulls your chart of accounts and your historical data.
Marge builds your financial picture
Your accounts are mapped to standard categories, every metric is calculated, and the analysis is provided.
Review and report
Review analysis, ask questions, assess benchmarks, create decks and make informed decisions.
No QuickBooks? Upload your financials instead
You get the same dashboard, score, benchmarks and analysis either way. Pre-built templates also cover the operating data not found in your accounting system.
- Headcount & Payroll
- Annual Budget
- Customer Metrics
- Sales Pipeline
- Product/Unit Economics
- Revenue by Customer
- Revenue by Product
- Profit & Loss
- Balance Sheet
One price per company, no per-seat charges
Pay annually and save up to 19%.
Essentials
The live dashboard, the written analysis, and your monthly digest.
- QuickBooks sync or file upload
- KPIs and charts
- Profit & loss table
- Investor takeaways & CEO notes
- Monthly email digest
Growth
Most popularAdds the health score, benchmarks, forecasting and chat.
- Everything in Essentials
- Financial health score
- Benchmarks
- Forecast and scenarios
- Ask Marge chat
- 1,500 credits included
Enterprise
Adds board decks and a larger credit allowance.
- Everything in Growth
- Board deck builder
- PDF export
- Link your own Google Sheet forecast
- 5,000 credits included
Prices in USD. Credits cover chat and deck writing.
See what your numbers have been telling you
Connect QuickBooks or upload your financials, and get your first live dashboard in about ten minutes.